
Every location. Every dollar. One view.
For DSOs and group practices: one page for the whole group and one queue for the central billing office, with one click into any location.
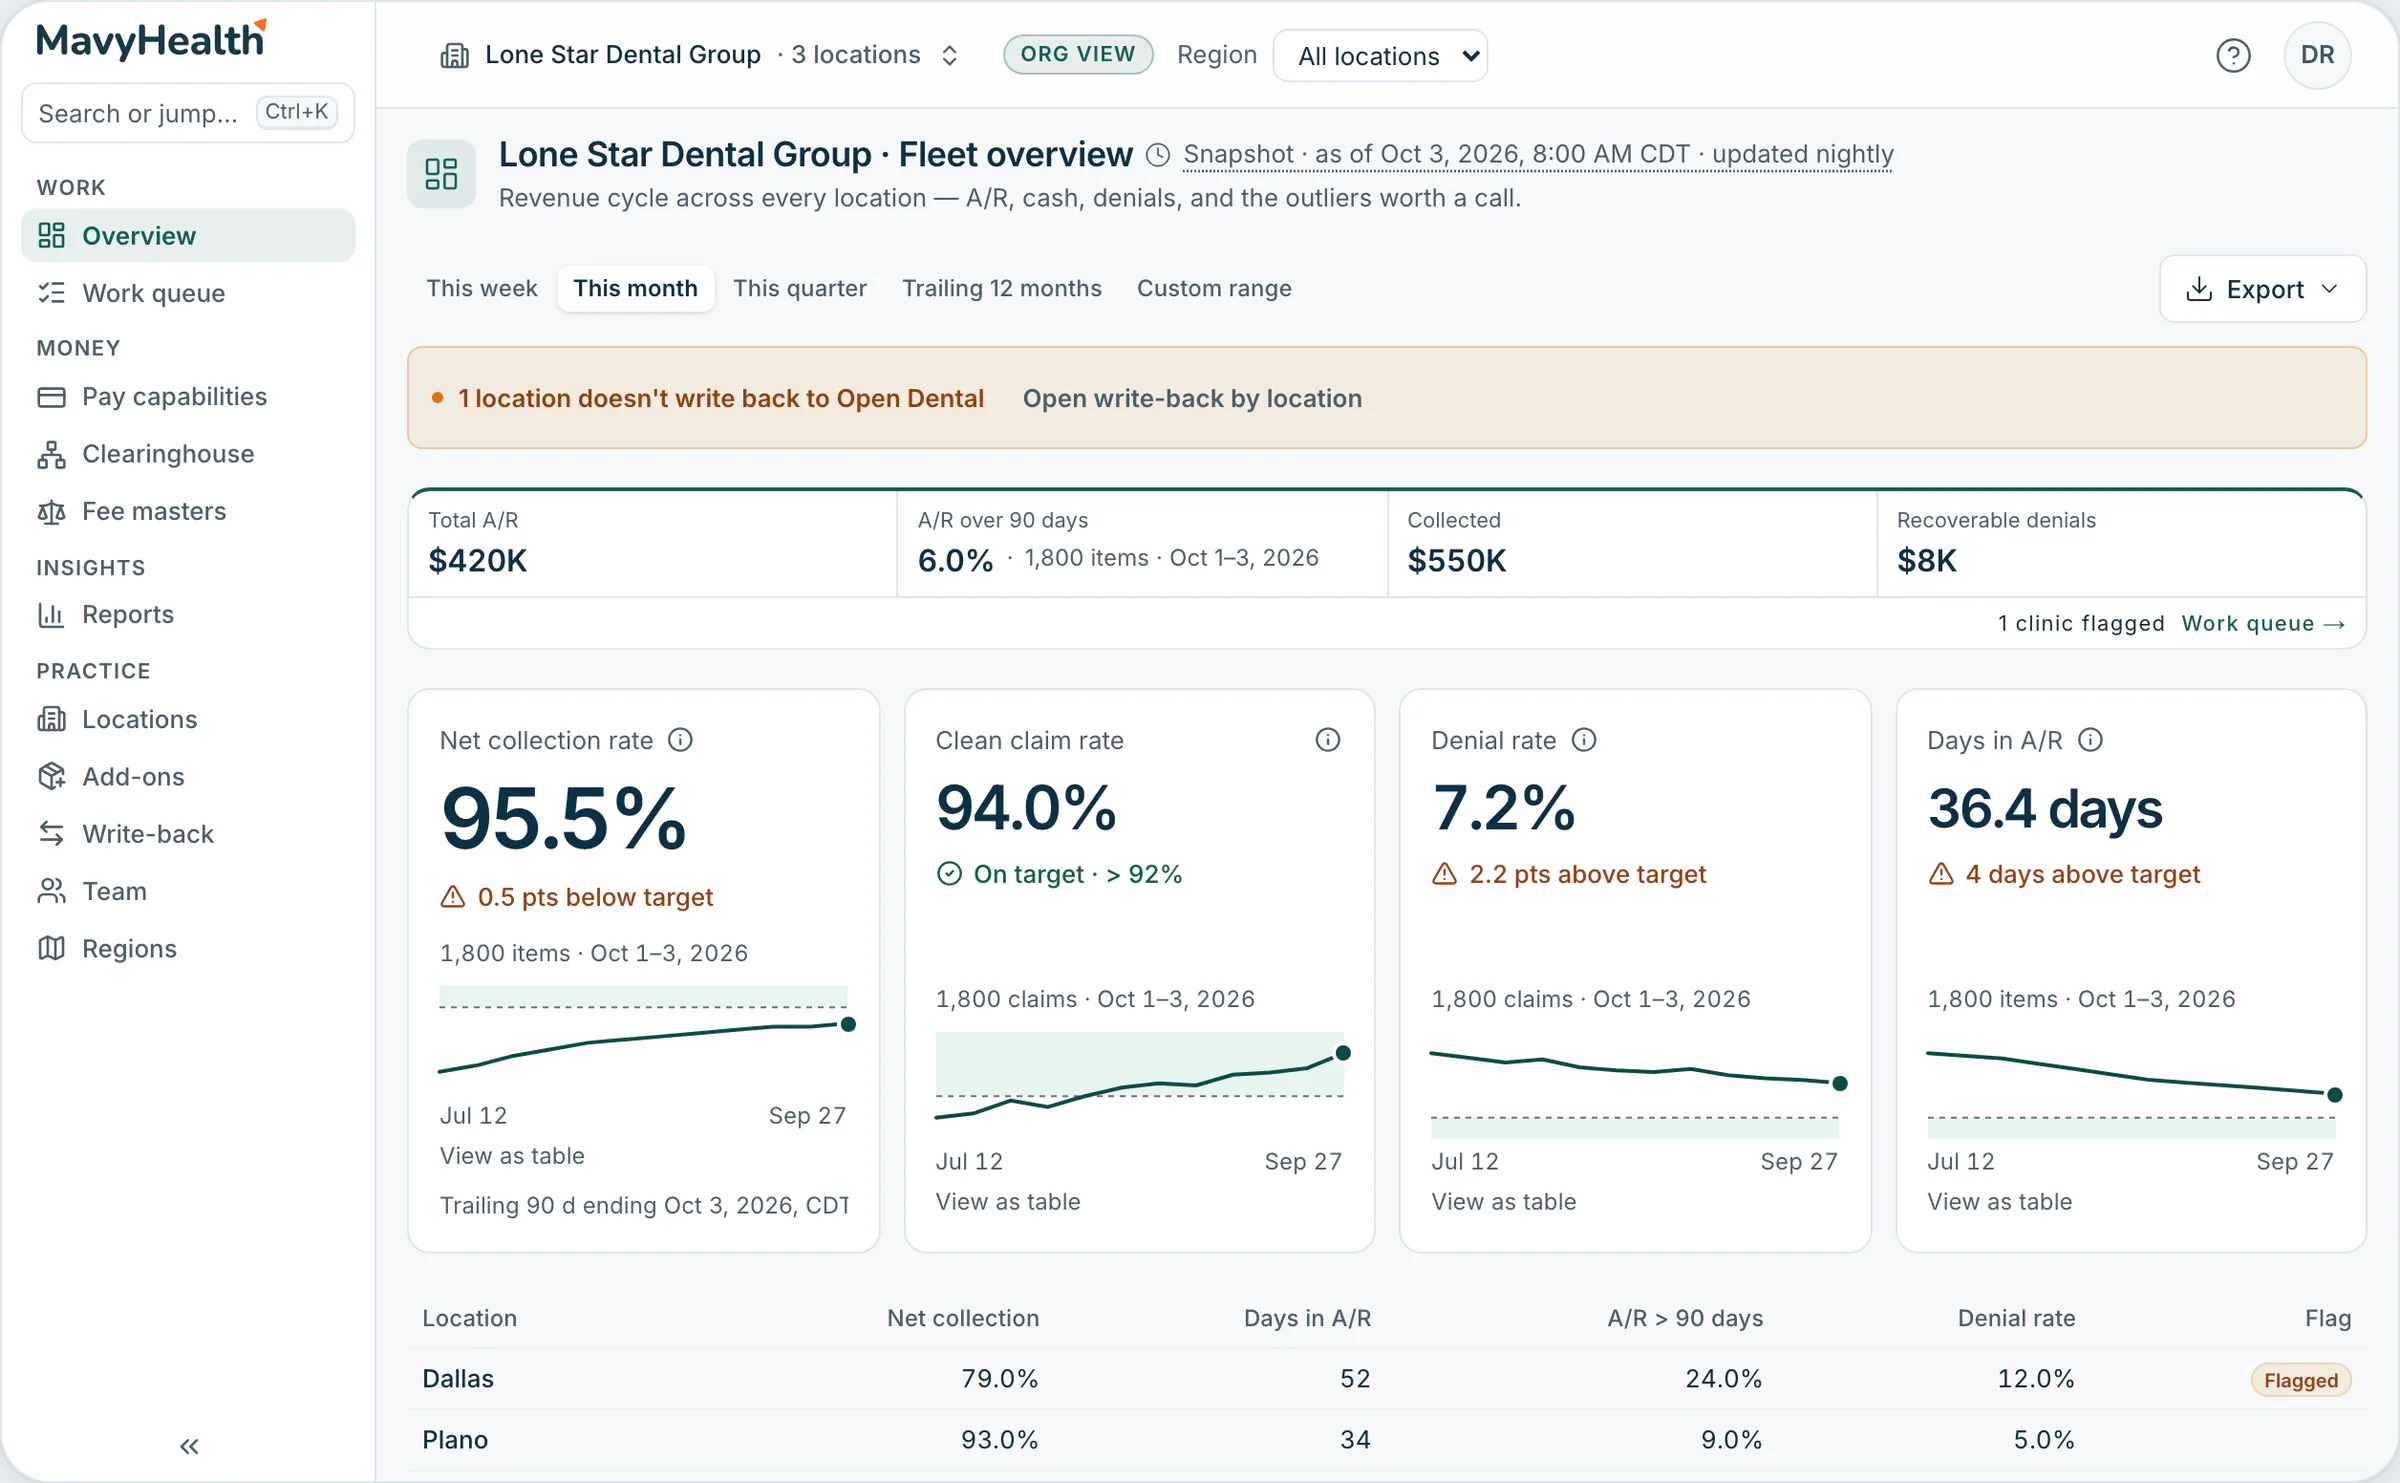
Screens simulated from a demo group. Locations and figures are fictional.
Built for the central billing office, not just the clinic.
The outliers worth a call, flagged.
Every location on the same metrics, with targets, so a location that drifts shows up before the month closes.
- Net collection, clean claims, denials, days in A/R, A/R over 90
- Week, month, quarter, trailing 12 months or a custom range
- Regions for groups that manage by market
One queue for every location’s work.
Denials, underpayments, pre-visit gaps and claims waiting to send, across every location, sorted by dollars at risk.
- The location on every row, one click into its clinic
- Deadlines labelled as estimates, to confirm with the payer
Roll out at your pace, location by location.
Every location starts read-only. Turn on write-back to Open Dental where a location is ready, one category at a time.
- Roles for every seat, from billing staff to group leadership
- Your clearinghouse contracts stay as they are
Group pricing: flat per location, by location band.
Never a percentage of collections. Keep your clearinghouse contracts and Open Dental.
Bring your group’s hardest questions.
We’ll walk the org view, the work queue and write-back controls on a demo group, then talk about your locations.